
Almost every beginner I teach arrives with the same quiet embarrassment: they have heard of Google Analytics, they may even have it installed, but they have never once opened it and understood what they were looking at. If that is you, relax. These three tools are genuinely simple once somebody explains what each one is FOR, and the reason they feel confusing is that most tutorials start clicking buttons before explaining the point. So we will do it the other way around. First you will understand what each tool actually does in plain language, then we will set all three up in the correct order, then I will show you the handful of reports that matter and the 15-minute weekly routine I use on real client accounts. Everything here is free, forever, and by the end you will be able to answer the only question that matters: is my marketing actually working?
Google Analytics 4 (GA4) tells you what people do after they land on your website: which pages they visit, how long they stay, and whether they fill your form. Google Search Console (GSC) tells you what happens before they arrive: which searches showed your site, how many people clicked, and whether Google can even read your pages. Google Tag Manager (GTM) does not report anything at all; it is the delivery system that installs and manages your tracking codes without touching your website’s code every time. In short: GTM installs the tracking, GA4 measures behaviour on your site, GSC measures your visibility in Google Search. You need all three, they are all free, and the correct setup order is GTM first, then GA4, then GSC.
• Measurement is the one skill every other marketing lane depends on, which is why analytics specialists reach ₹14 to 17 LPA at senior level while generalists plateau around ₹8 to 10 LPA
• All three tools cost ₹0, so the barrier is knowledge, not budget
• In a zero-click world where 60%+ of searches end without a visit, Search Console is often the only place you can see the demand you are earning but not receiving
• The most common cause of “our marketing is not working” is not bad marketing. It is broken or missing tracking, which makes working campaigns look dead
1. The Three Tools, Explained in Plain English
Forget the official descriptions for a moment. Here is how I explain these to every new student, using a shop analogy that has never failed me.
Imagine you own a physical shop. Search Console is the window and the street outside. It tells you how many people walked past, what sign they were looking for, and how many decided to come in. Analytics is the CCTV inside the shop. It tells you where people went, what they picked up, how long they stayed, and whether they reached the counter. Tag Manager is the electrician. It does not watch anything; it installs the cameras and sensors so the other systems can do their jobs, without you rebuilding the wall every time you add one.
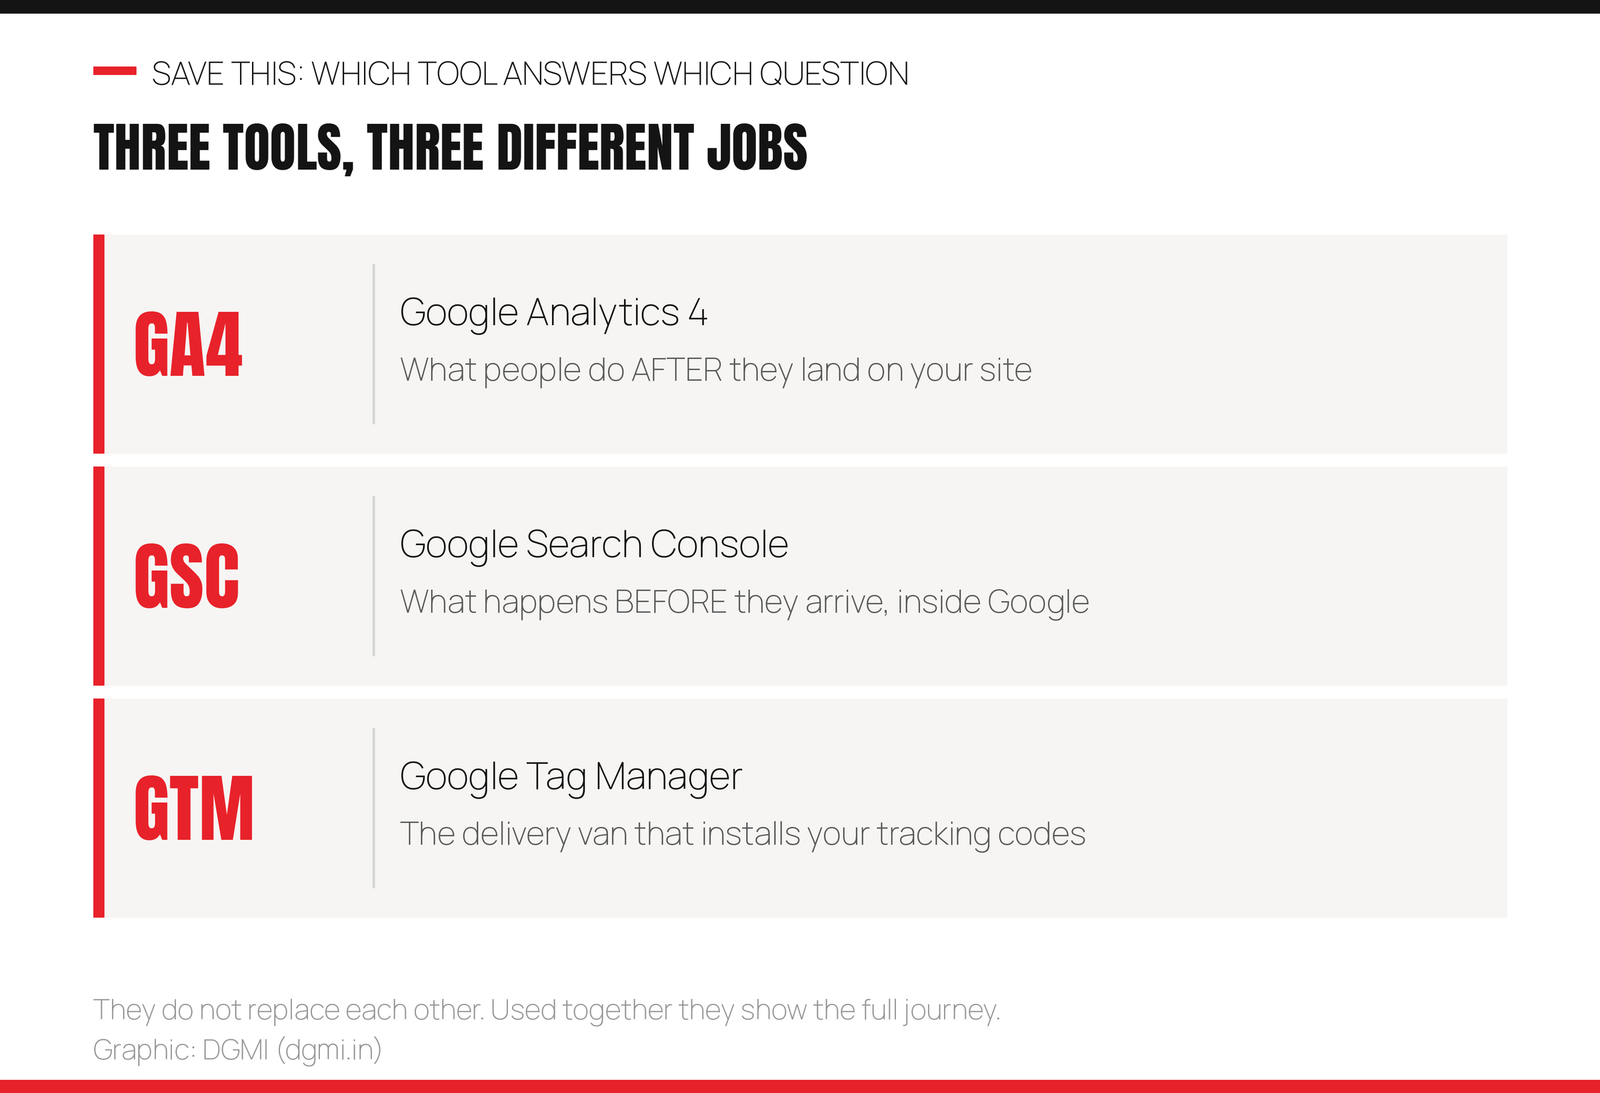
This distinction matters more than it sounds, because beginners constantly ask the wrong tool the wrong question. “Why is my traffic down?” is usually a Search Console question. “Why do people leave without enquiring?” is a GA4 question. “Why is my form not being counted?” is almost always a Tag Manager question. Knowing which tool owns which question saves hours of confused clicking.
2. How They Connect (and the Right Setup Order)
Here is where the data physically comes from, which makes the setup order obvious.
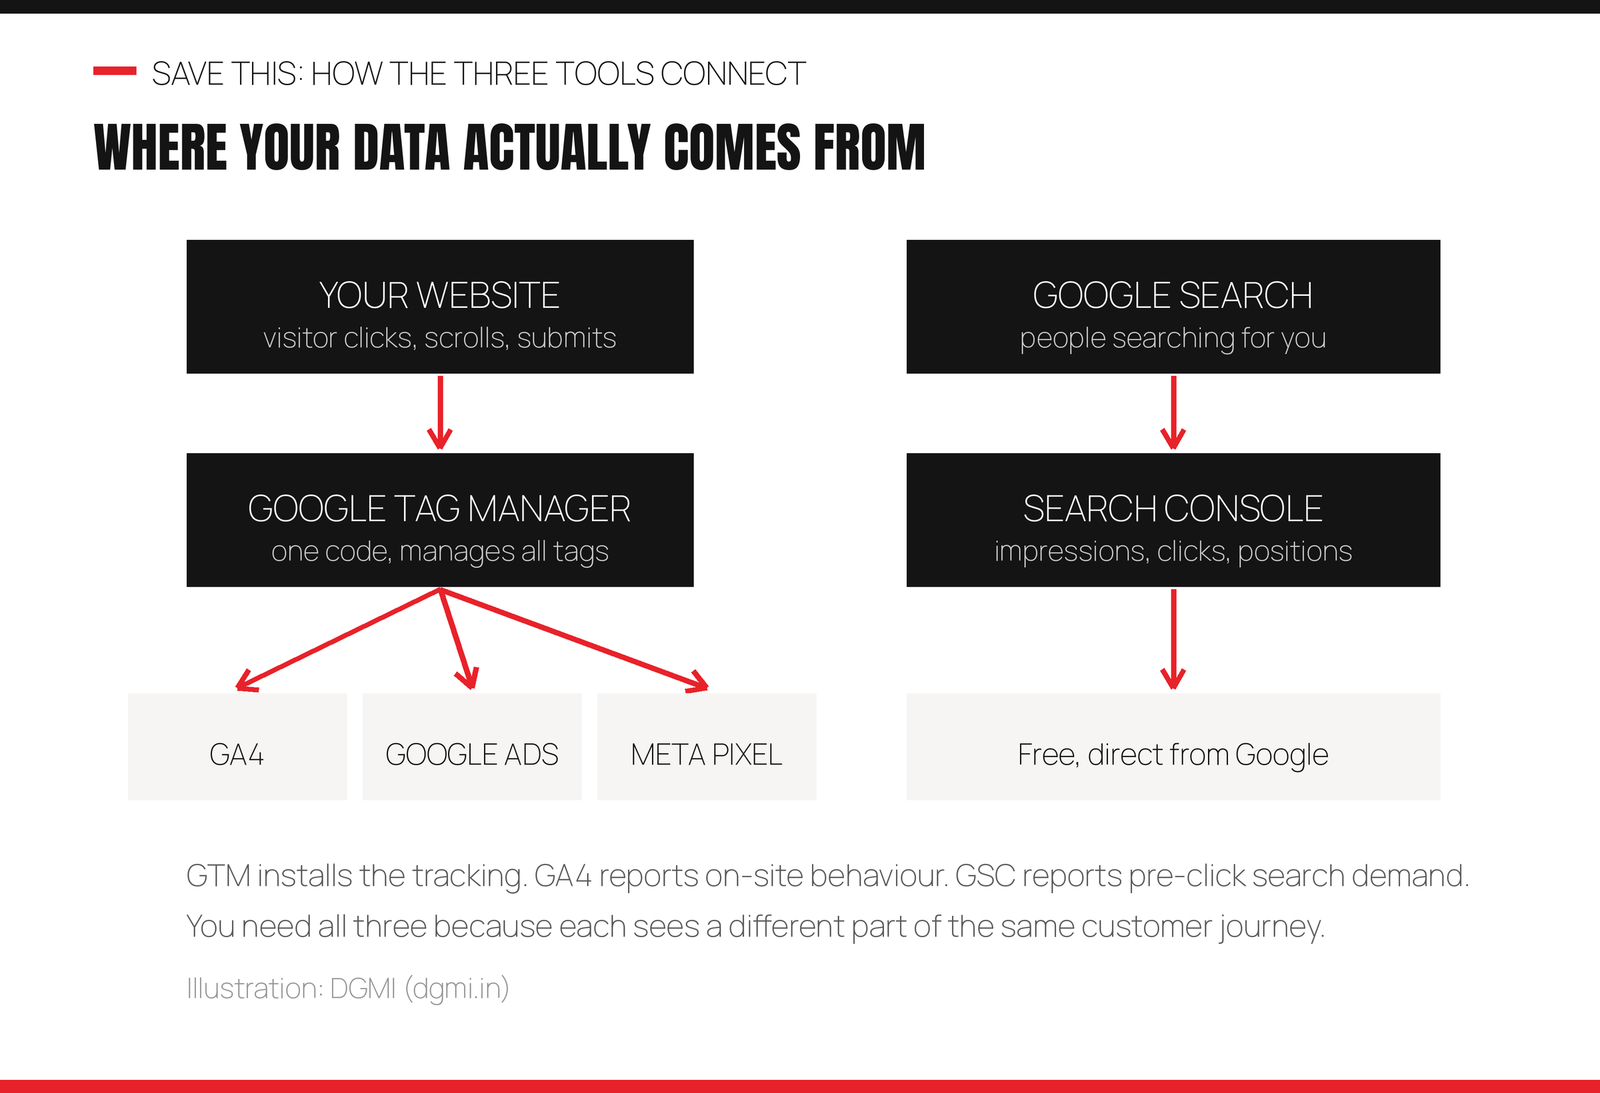
Notice the two separate paths. On the left, your website feeds Tag Manager, and Tag Manager feeds everything else: GA4, Google Ads conversion tracking, a Meta pixel if you run Facebook or Instagram ads. On the right, Search Console gets its data straight from Google itself, with no code on your site at all beyond a one-time ownership check.
So the correct order to set things up is: Tag Manager first (because it will install everything else), GA4 second (delivered through Tag Manager), and Search Console third (independent, and easiest of the three). People who install GA4 by pasting code directly into their theme usually regret it within a month, when they need to add a second tracking code and have to touch the website again.
3. Google Tag Manager: Setup and How It Works
GTM scares beginners more than the other two combined, entirely because of vocabulary. Let me remove that fear right now, because the whole system is just three words.
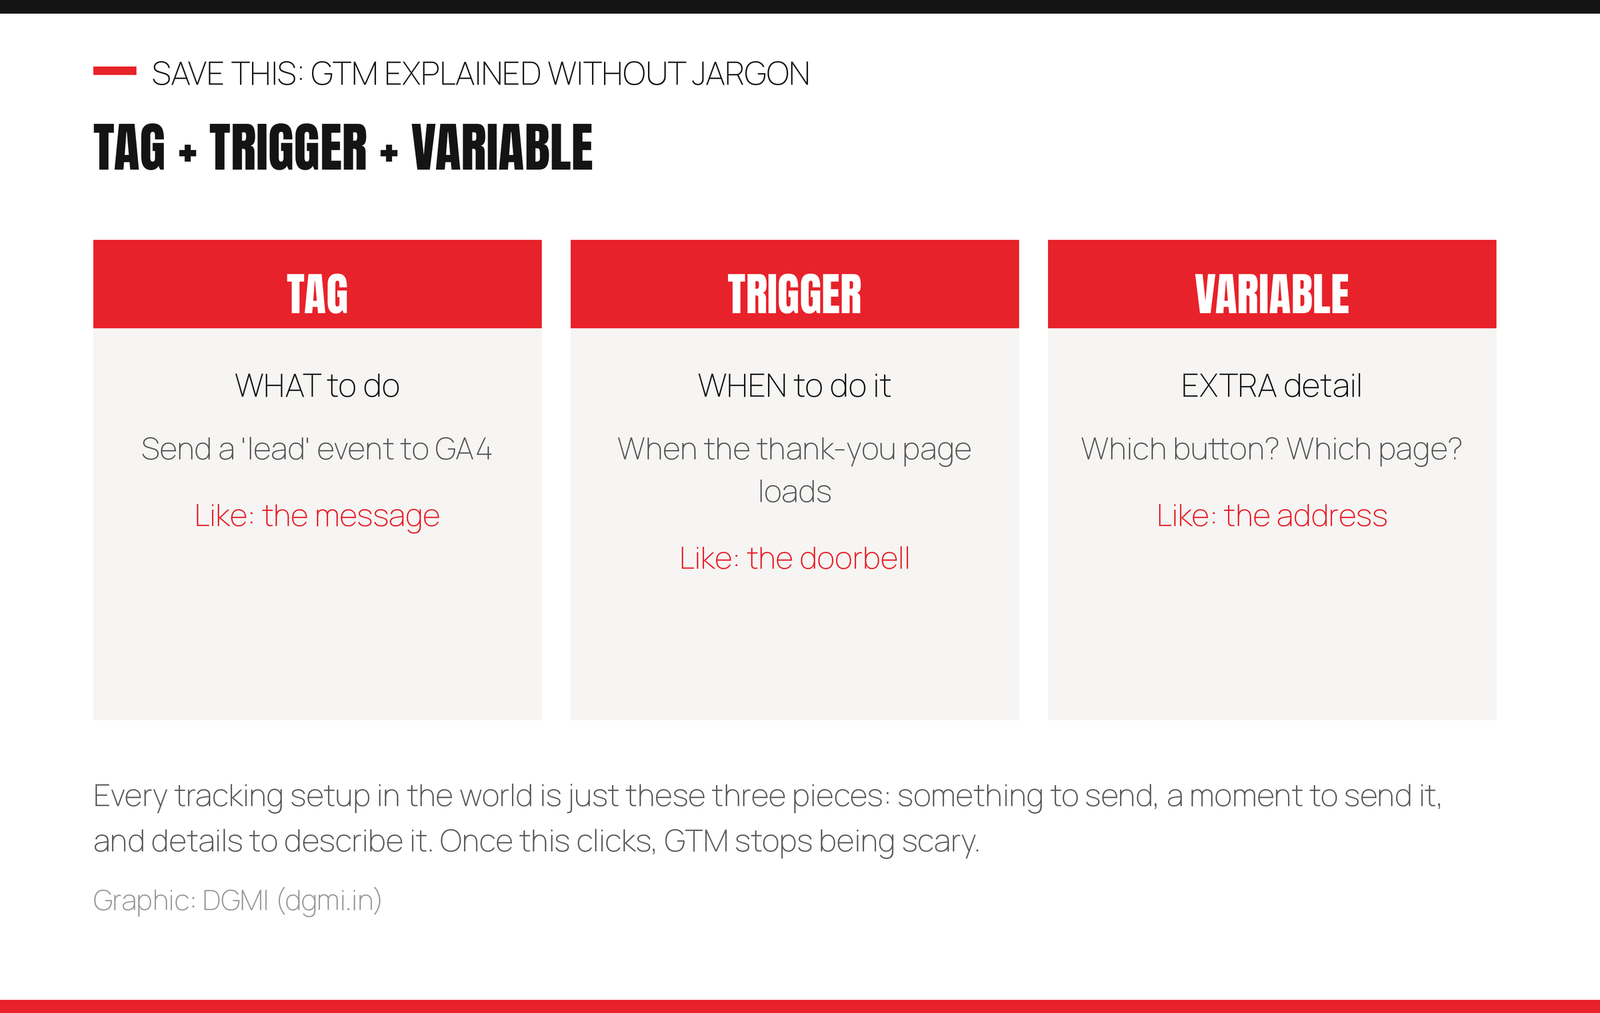
A tag is the thing you want to happen (“send a lead event to GA4”). A trigger is the moment it should happen (“when someone lands on the thank-you page”). A variable is the extra detail (“which button did they click?”). That is genuinely it. Every tracking setup in the world, however complicated it looks, is made of those three pieces.
Setting up GTM, step by step
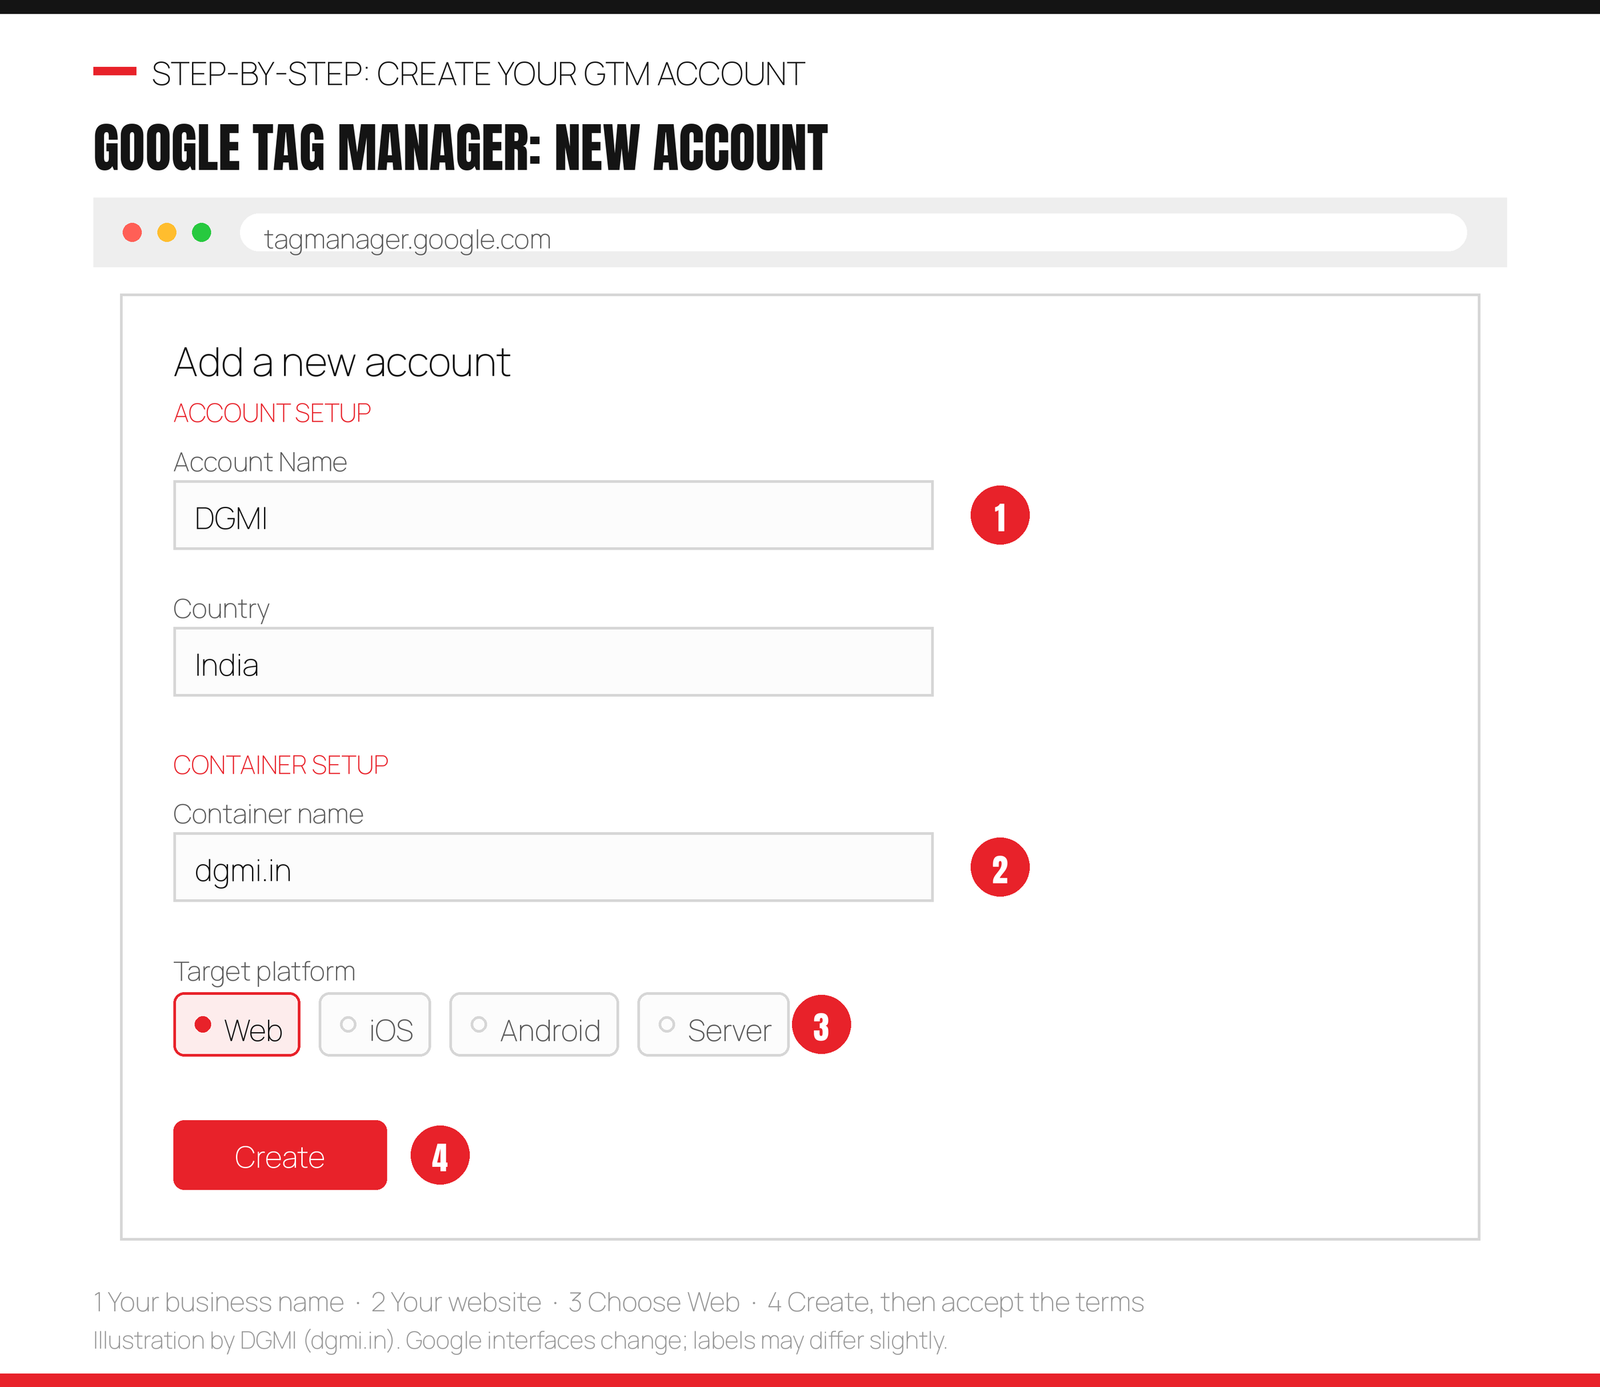
- Step 1. Go to tagmanager.google.com and sign in with the Google account you want to own this forever. Use a business account, not a personal one you might lose access to; account ownership problems are the most boring disaster in this field.
- Step 2. Click Create Account. Enter your business name, country, then your website URL as the container name, and choose Web as the target platform.
- Step 3. GTM shows you two code snippets and an ID that looks like GTM-XXXXXXX. On WordPress, the easy path is a plugin that asks only for that ID. Otherwise the first snippet goes in the head section and the second immediately after the body opening tag.
- Step 4. Verify it works using GTM’s Preview mode, which opens your site in a special debug window and shows what fires. If Preview connects, your container is live.
- Step 5. Remember the golden rule that catches every beginner: nothing in GTM goes live until you press Submit and Publish. Building a perfect tag and forgetting to publish is the single most common GTM mistake, and I have made it myself on a client account while wondering for an hour why no data appeared.
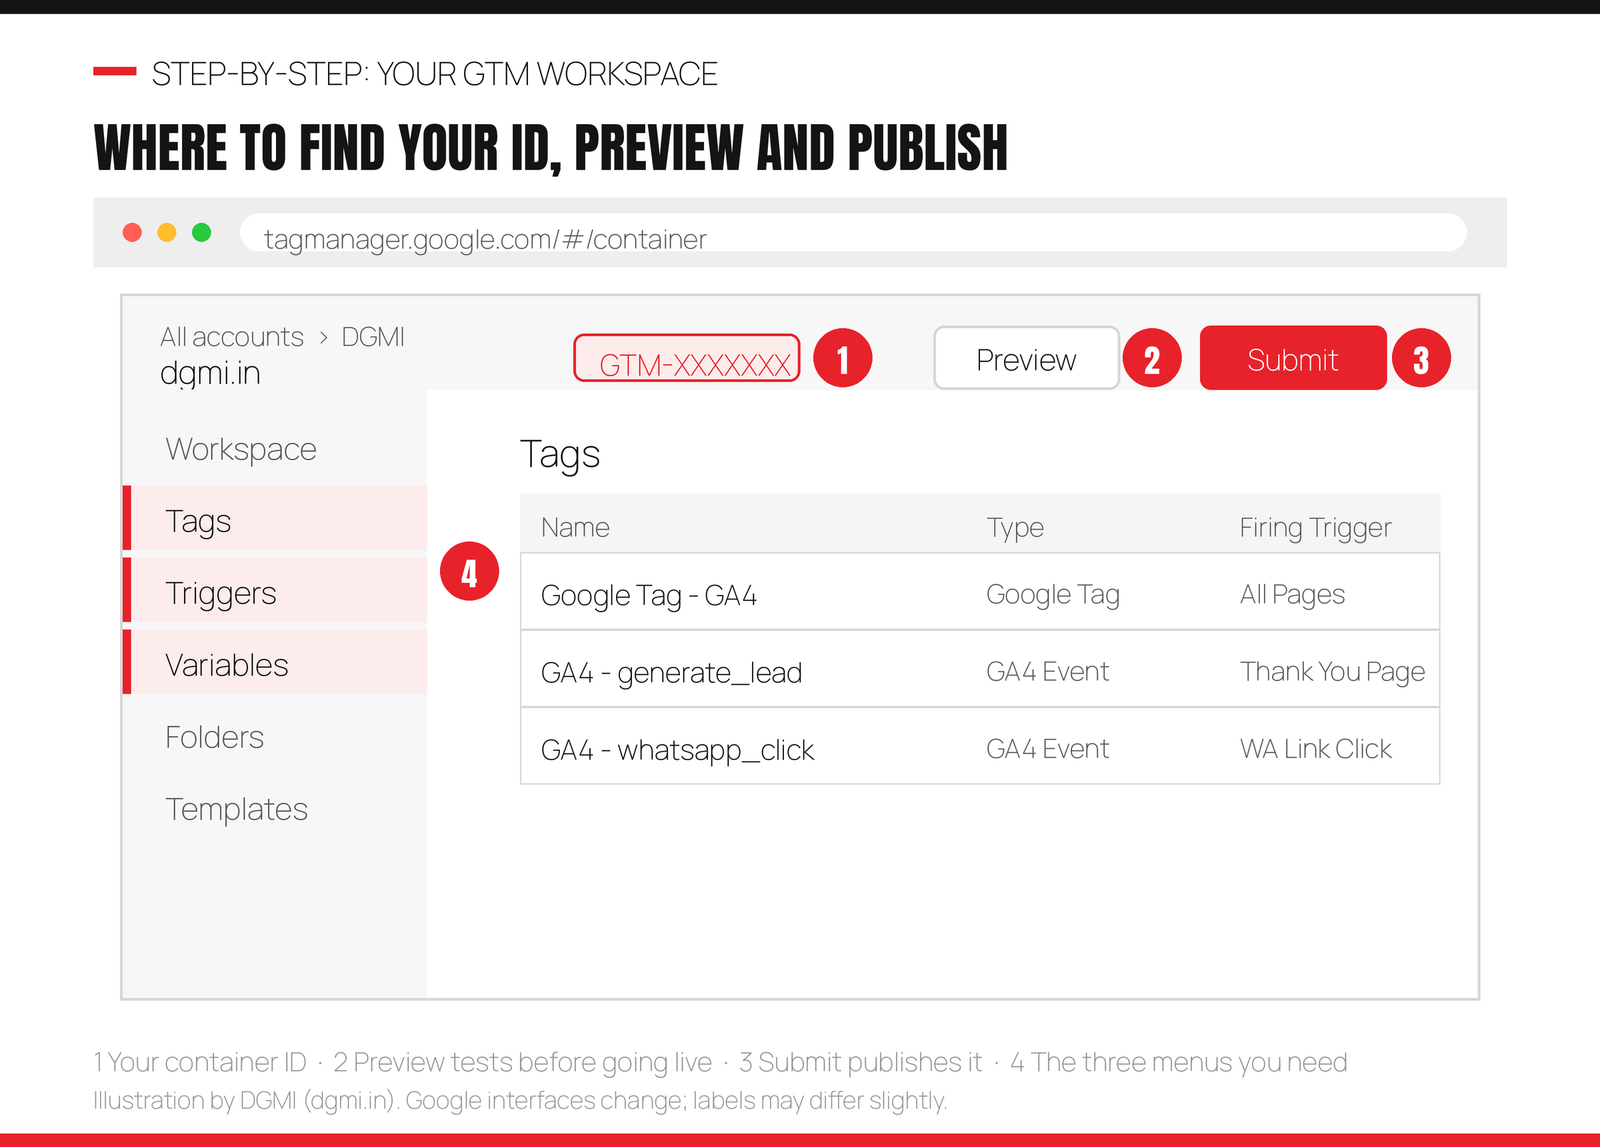
Once GTM is live you rarely touch your website’s code again, which is precisely the point: adding a Google Ads conversion tag or a Meta pixel later becomes a five-minute job inside GTM rather than a developer request.
4. Google Analytics 4: Setup, Step by Step
GA4 replaced the older Universal Analytics in 2023, so any tutorial mentioning “bounce rate” as a main metric or “goals” instead of “key events” is out of date. Here is the current setup, in the order that prevents rework.
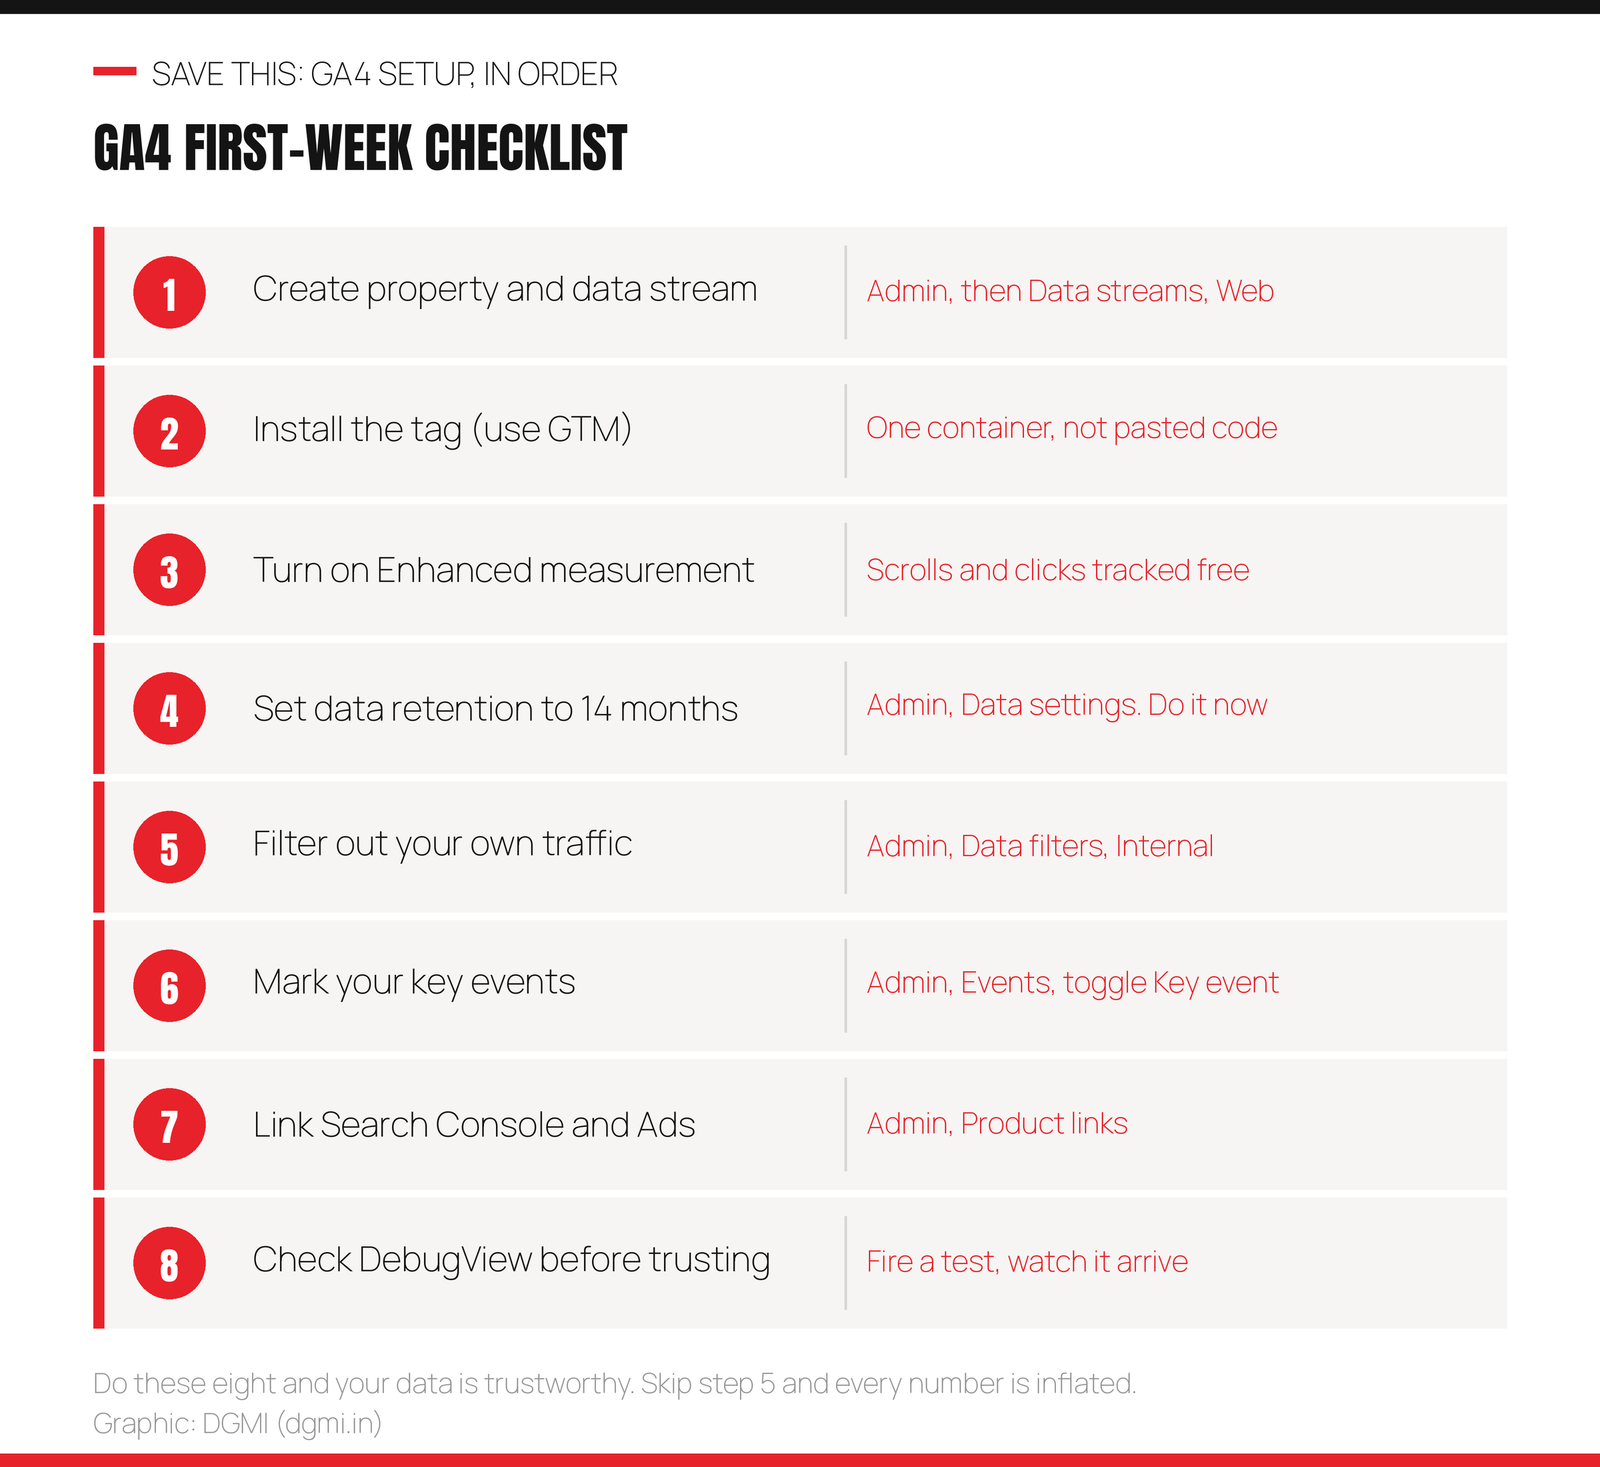
1. Create the property and data stream. At analytics.google.com, create an account, then a property (your website), then under Admin choose Data streams and add a Web stream with your URL. GA4 gives you a Measurement ID that looks like G-XXXXXXXXXX. Copy it.
2. Install it through GTM, not by pasting code. In GTM: New Tag, choose the Google Tag type, paste your G- ID, set the trigger to All Pages, save, then Submit and Publish. This single decision saves you hours later, because every future tag now lives in one place.
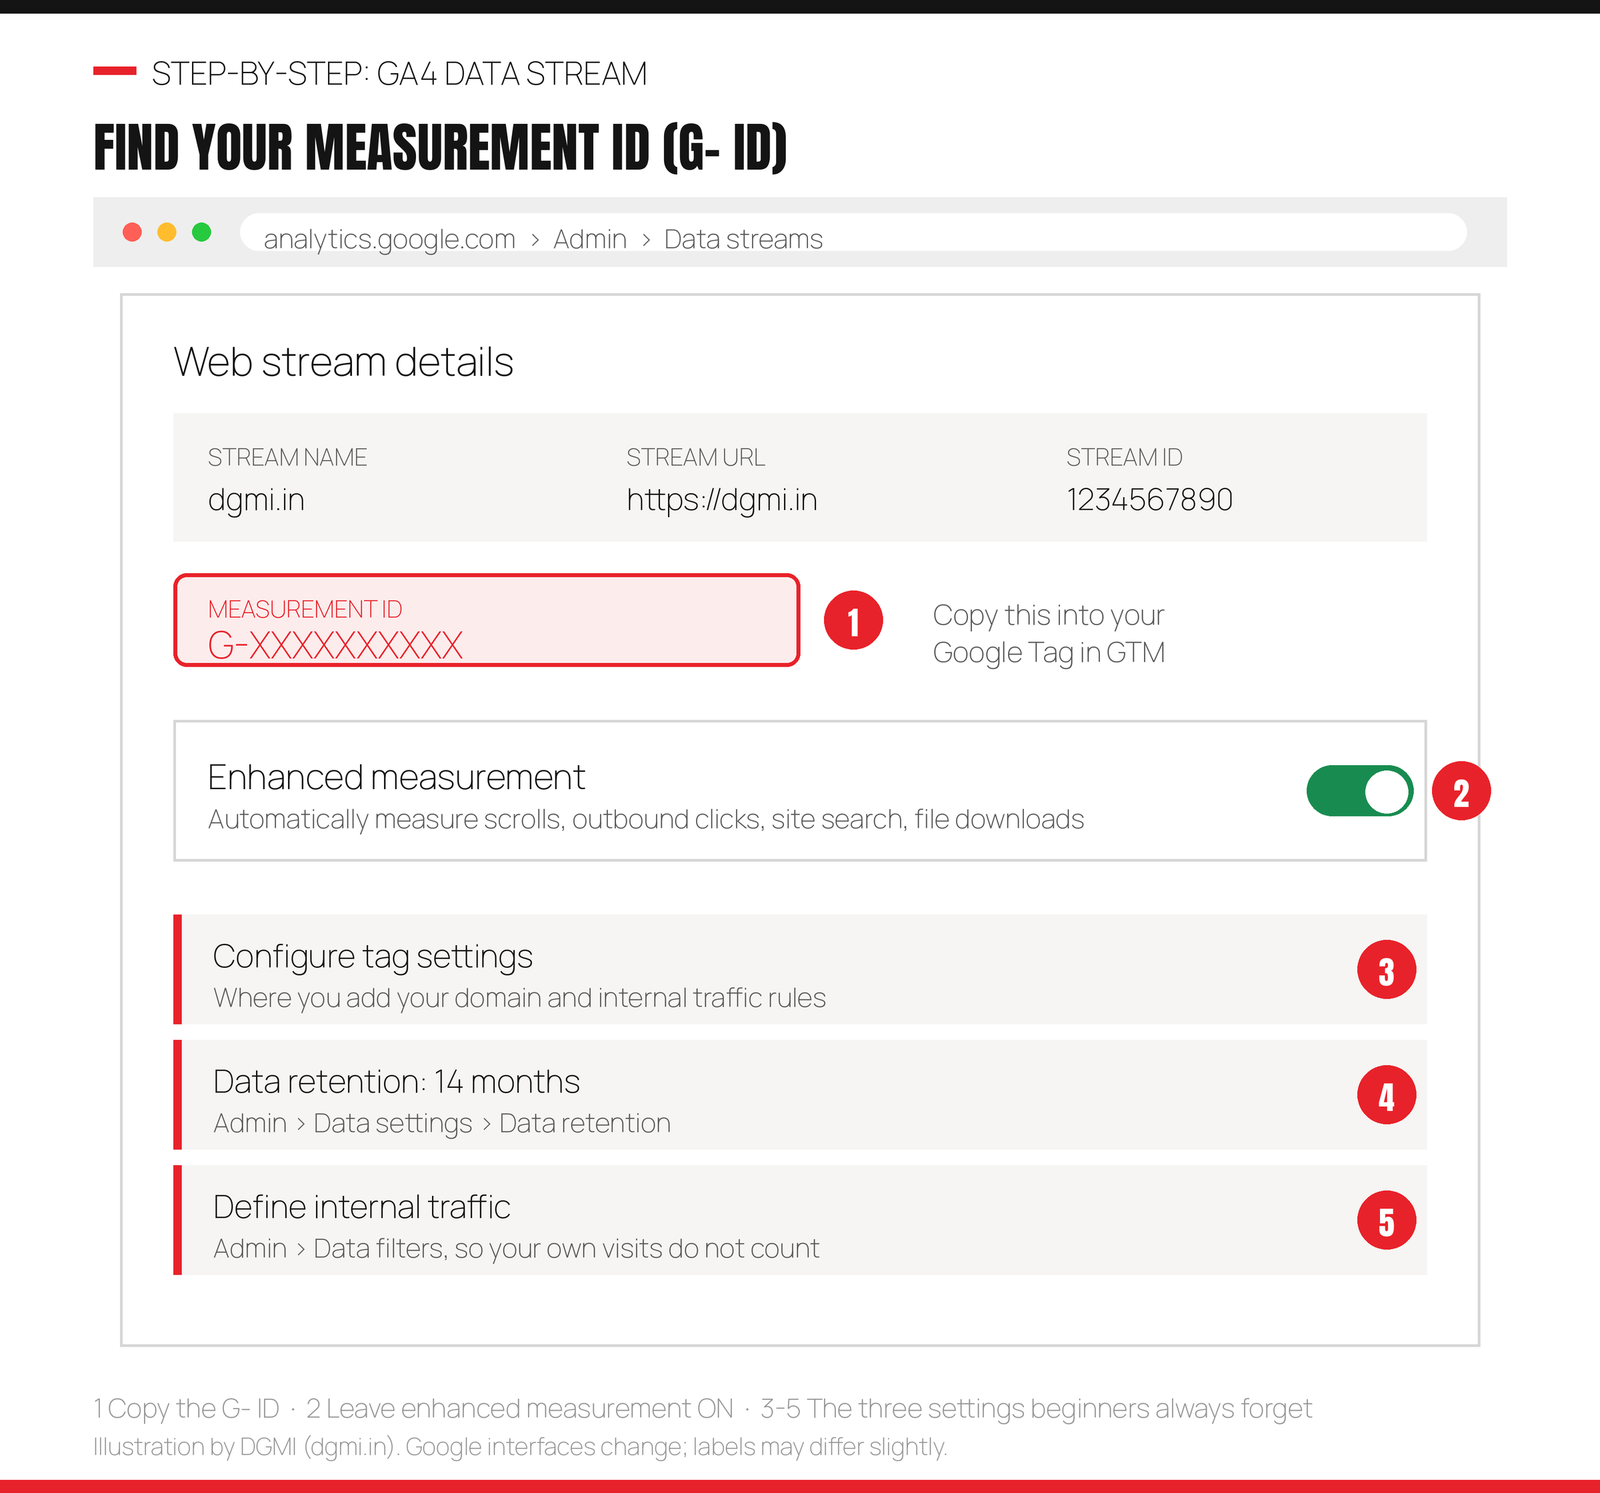
3. Turn on Enhanced measurement. Inside your Web data stream there is a toggle that automatically tracks scrolls, outbound clicks, site searches and file downloads with no extra work. Leave it on; it is free data.
4. Set data retention to 14 months. Admin, then Data settings, then Data retention. GA4 defaults to a short window, and once data is gone it is gone. This takes ten seconds and you will thank yourself in a year.
5. Filter out your own traffic. If you and your team visit the site daily, your own visits pollute every number. In Admin, Data filters, set up an internal traffic filter. This is the step beginners skip most often, and it is why a small site’s data often looks mysteriously busy but never converts.
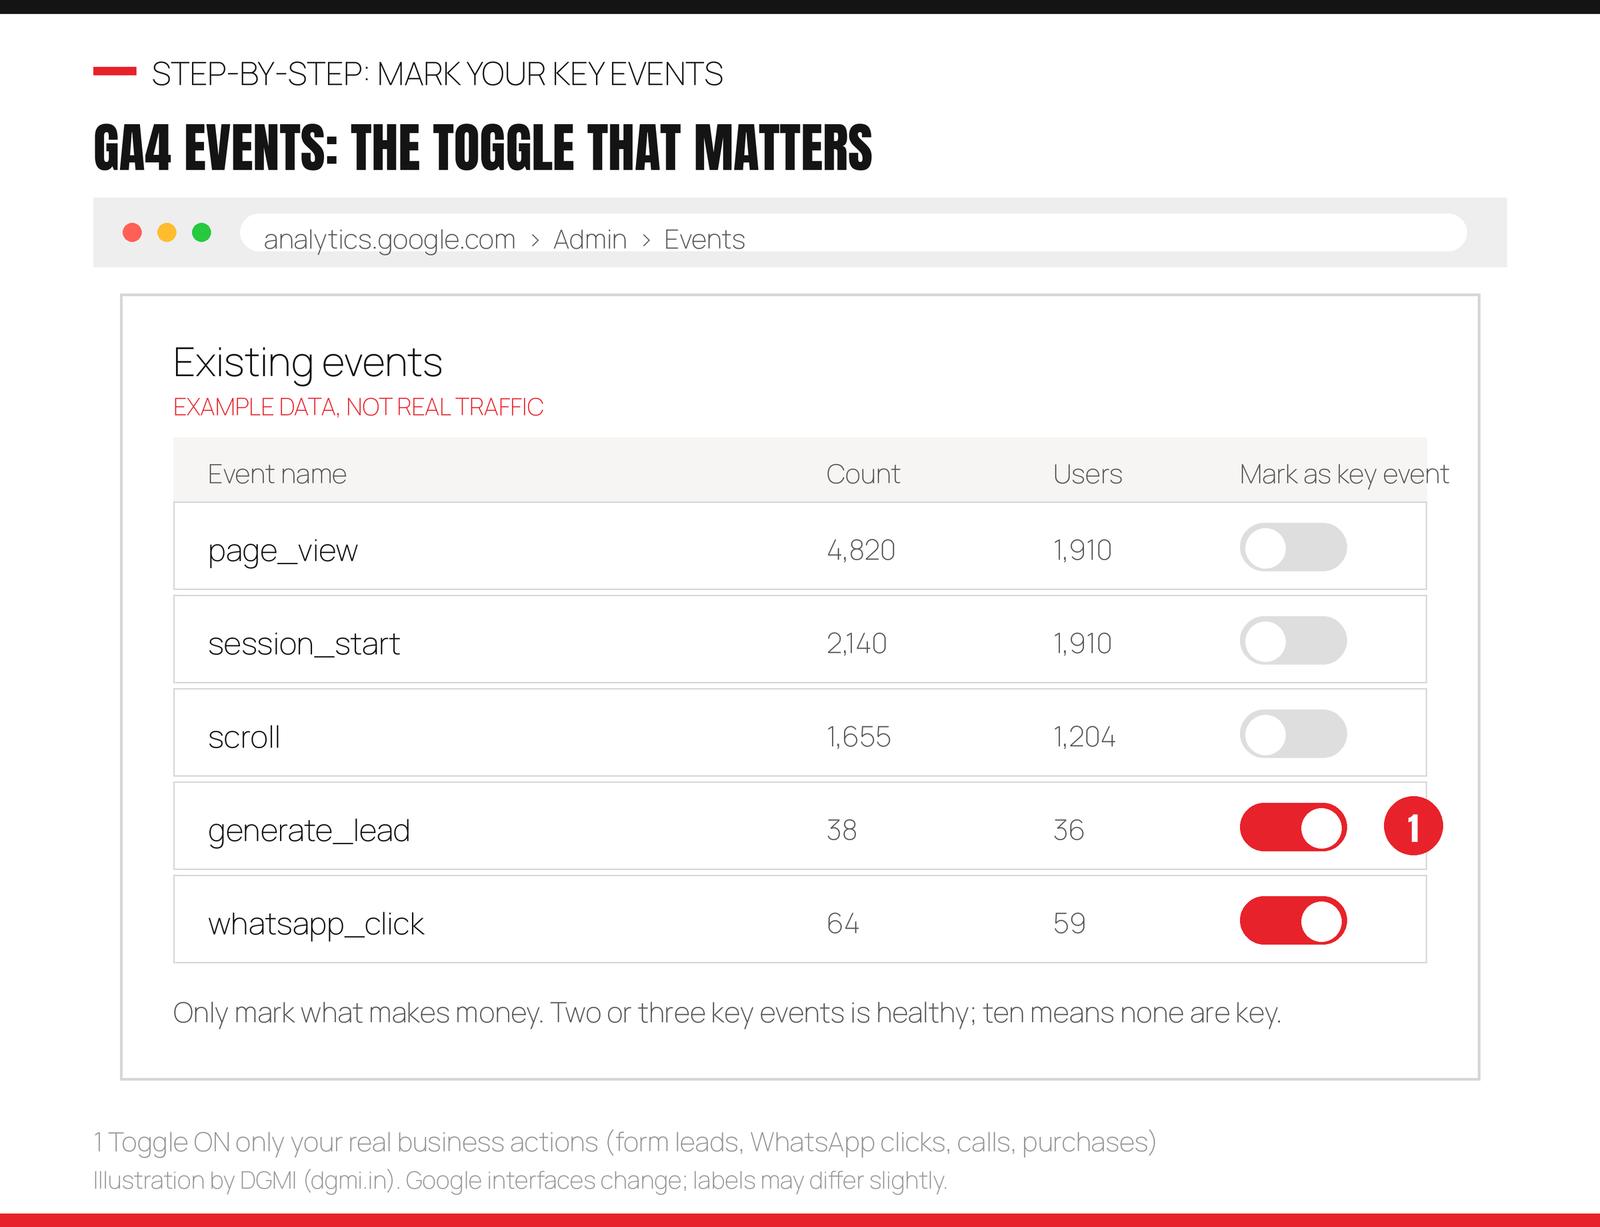
6. Mark your key events. This is the terminology change that confuses people reading old tutorials: in March 2024 Google renamed GA4 “conversions” to key events. The word “conversion” now belongs to Google Ads. The flow is: something happens (event) → you mark it important in GA4 (key event) → if you import it into Google Ads it becomes a conversion there. In Admin, Events, you simply toggle any event to mark it as a key event.
7. Link Search Console and Google Ads. Admin, then Product links. Linking Search Console lets you see search queries inside GA4; linking Ads lets you import key events for campaign optimisation. One caution: do not track the same action through both a GA4 import and a native Ads tag, or you will double-count it. Pick one.
8. Verify with DebugView before trusting anything. Open Admin, DebugView, then use GTM Preview mode on your site and perform a test action. If you see the event arrive in DebugView, your tracking is real. If not, fix it now rather than discovering three months of empty data later.
🎯 Reading Guides Is Good. Doing It Live Is Better.
In DGMI’s free demo class we can set this up together on a real website, yours or a practice one, so you watch data appear in GA4 within the hour. That single experience removes the fear permanently. 100% practical, 1:1, zero cost.
5. The GA4 Reports That Actually Matter
GA4 has dozens of reports and a beginner needs about five. Ignore the rest until these feel comfortable.
Reports, then Acquisition, then Traffic acquisition. This answers “where do my visitors come from?” and breaks traffic into channels: Organic Search (Google, free), Paid Search (ads), Direct (typed your URL), Organic Social, Referral. This is the report I open first on any new account, because it instantly shows which marketing is actually delivering people.
Reports, then Engagement, then Pages and screens. Your most-visited pages, ranked. Use it to find your quiet winners: the page nobody planned that brings steady traffic, which usually deserves a proper call to action added to it.
Reports, then Engagement, then Events and Key events. Are your important actions being counted at all? If your key events show zero for a week on a site getting visitors, your tracking is broken, not your marketing.
Reports, then Retention or User attributes. Useful later, safe to ignore at the start.
Explore (the left menu icon). This is where you build custom views, for example “show me only visitors from Google who submitted the form.” Powerful, and worth learning after the basics are second nature.
One metric worth understanding early because everyone asks: GA4 does not have the old “bounce rate” as its headline number. It uses engagement rate instead, meaning the share of sessions where someone stayed a meaningful time, viewed multiple pages, or triggered a key event. It is a more honest measure, since a person reading your article for four minutes and leaving satisfied is not a failure.
6. Tracking Forms, Calls and WhatsApp Clicks
This is the part that converts analytics from interesting to genuinely valuable, because it connects your website to actual business outcomes. For most Indian small businesses there are exactly three actions worth tracking, and WhatsApp is usually the most important one.
Tracking a form submission (the thank-you page method)
The simplest reliable method: make your form redirect to a thank-you page after submission, for example yoursite.com/thank-you. Then in GTM create a GA4 Event tag named something like generate_lead, and give it a trigger of type Page View that fires only when the page path contains “thank-you”. Publish, test by submitting the form yourself, watch it appear in DebugView, then mark it as a key event in GA4. Done, and this method survives almost every form plugin change.
Tracking WhatsApp and phone clicks
In GTM, first enable the built-in click variables (Variables, Configure, tick the Click boxes). Create a trigger of type Click, Just Links, firing when Click URL contains “wa.me” for WhatsApp, or “tel:” for phone links. Attach a GA4 Event tag named whatsapp_click or call_click. Publish and test on your phone. I set this up for every local business client, because for many of them WhatsApp enquiries are the entire pipeline and they were previously invisible in reporting.
A word of honesty about what tracking cannot tell you: a WhatsApp click is not a customer, it is an intent signal. If ten people click and two buy, your real conversion story lives partly in your inbox, not your dashboard. Good marketers hold both. This is also why we teach reporting business outcomes rather than vanity metrics in our SEO business guide.
7. Search Console: Setup and the 5 Reports to Know
Search Console is the easiest of the three to set up and, for anyone doing SEO, the most valuable data you will ever get for free. It comes directly from Google, showing the searches where your site appeared.
Setting it up in five minutes
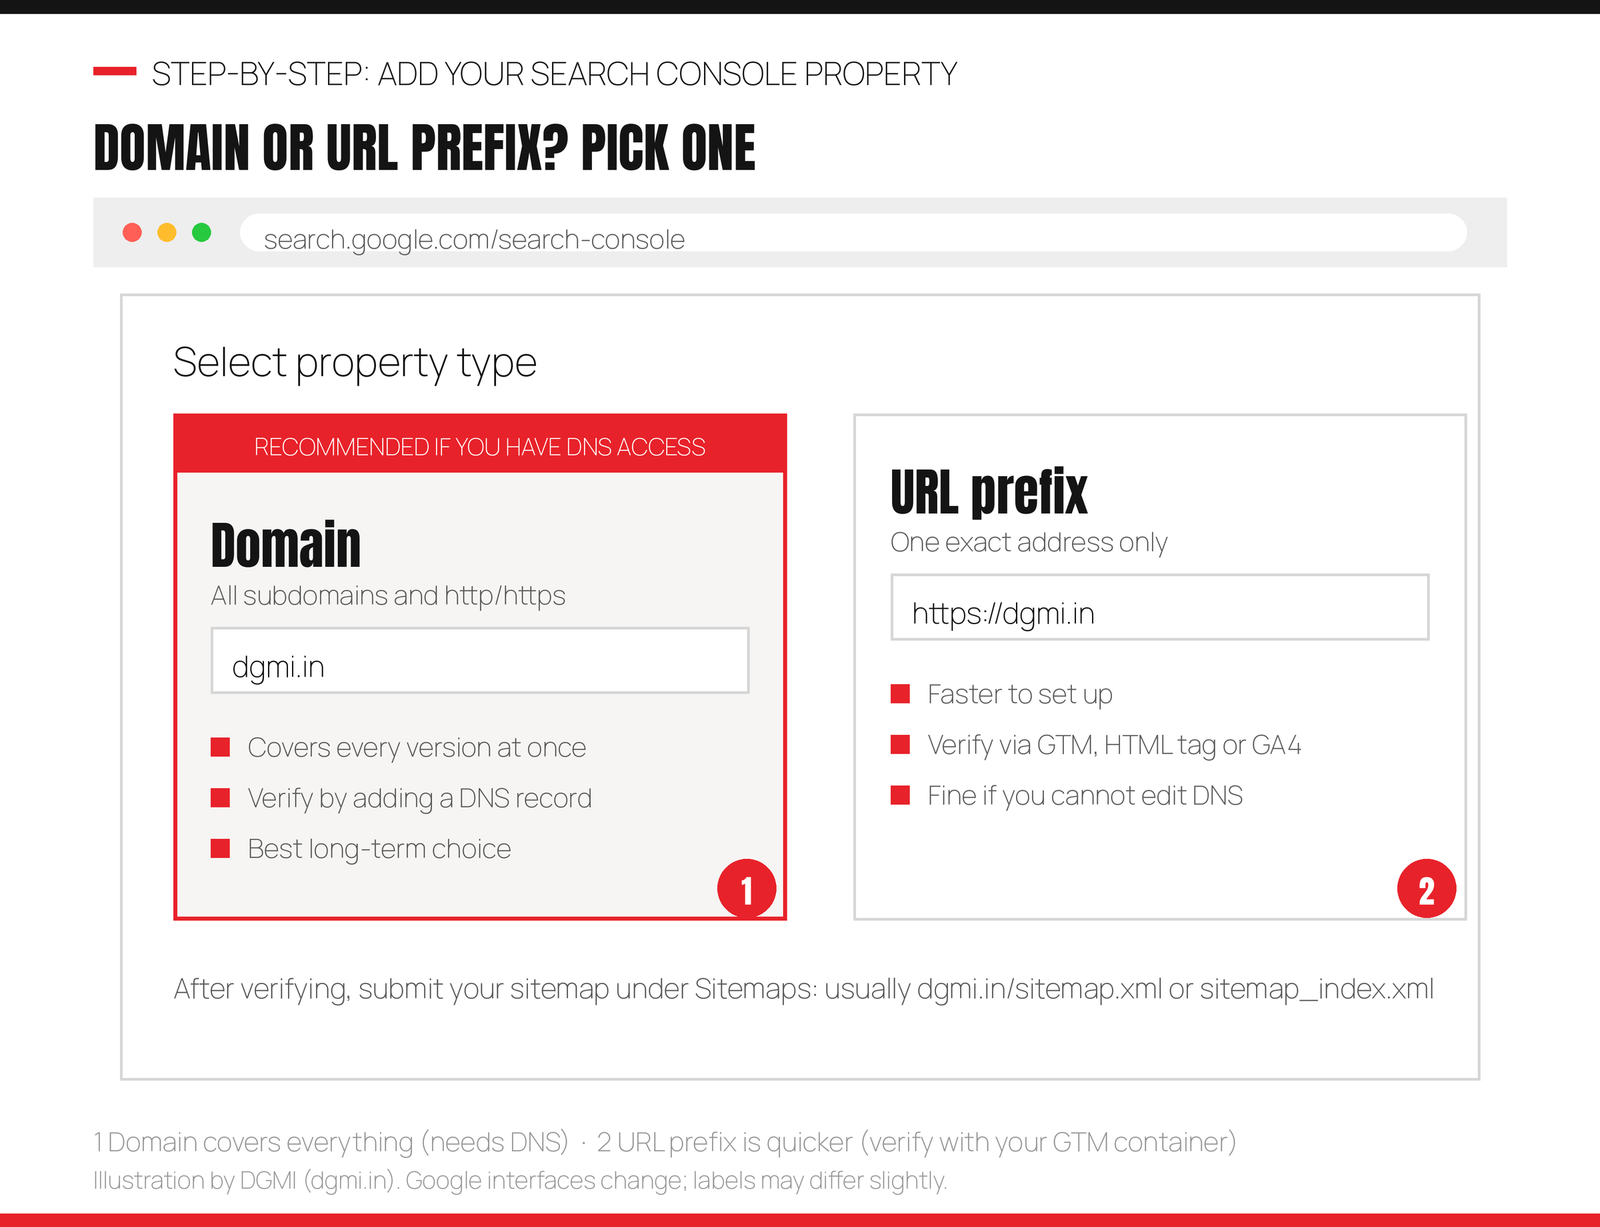
Go to search.google.com/search-console and add a property. You will be offered two types: Domain (covers every version of your site but requires adding a DNS record at your domain provider) or URL prefix (faster, verified by GTM, an HTML tag or your Google Analytics). If DNS access is available, choose Domain; it is the cleaner long-term choice. If not, URL prefix verified through your existing GTM container takes about a minute. Then submit your sitemap under Sitemaps, usually yoursite.com/sitemap.xml or sitemap_index.xml on WordPress. Data starts appearing within a couple of days, so do not panic at an empty dashboard on day one.
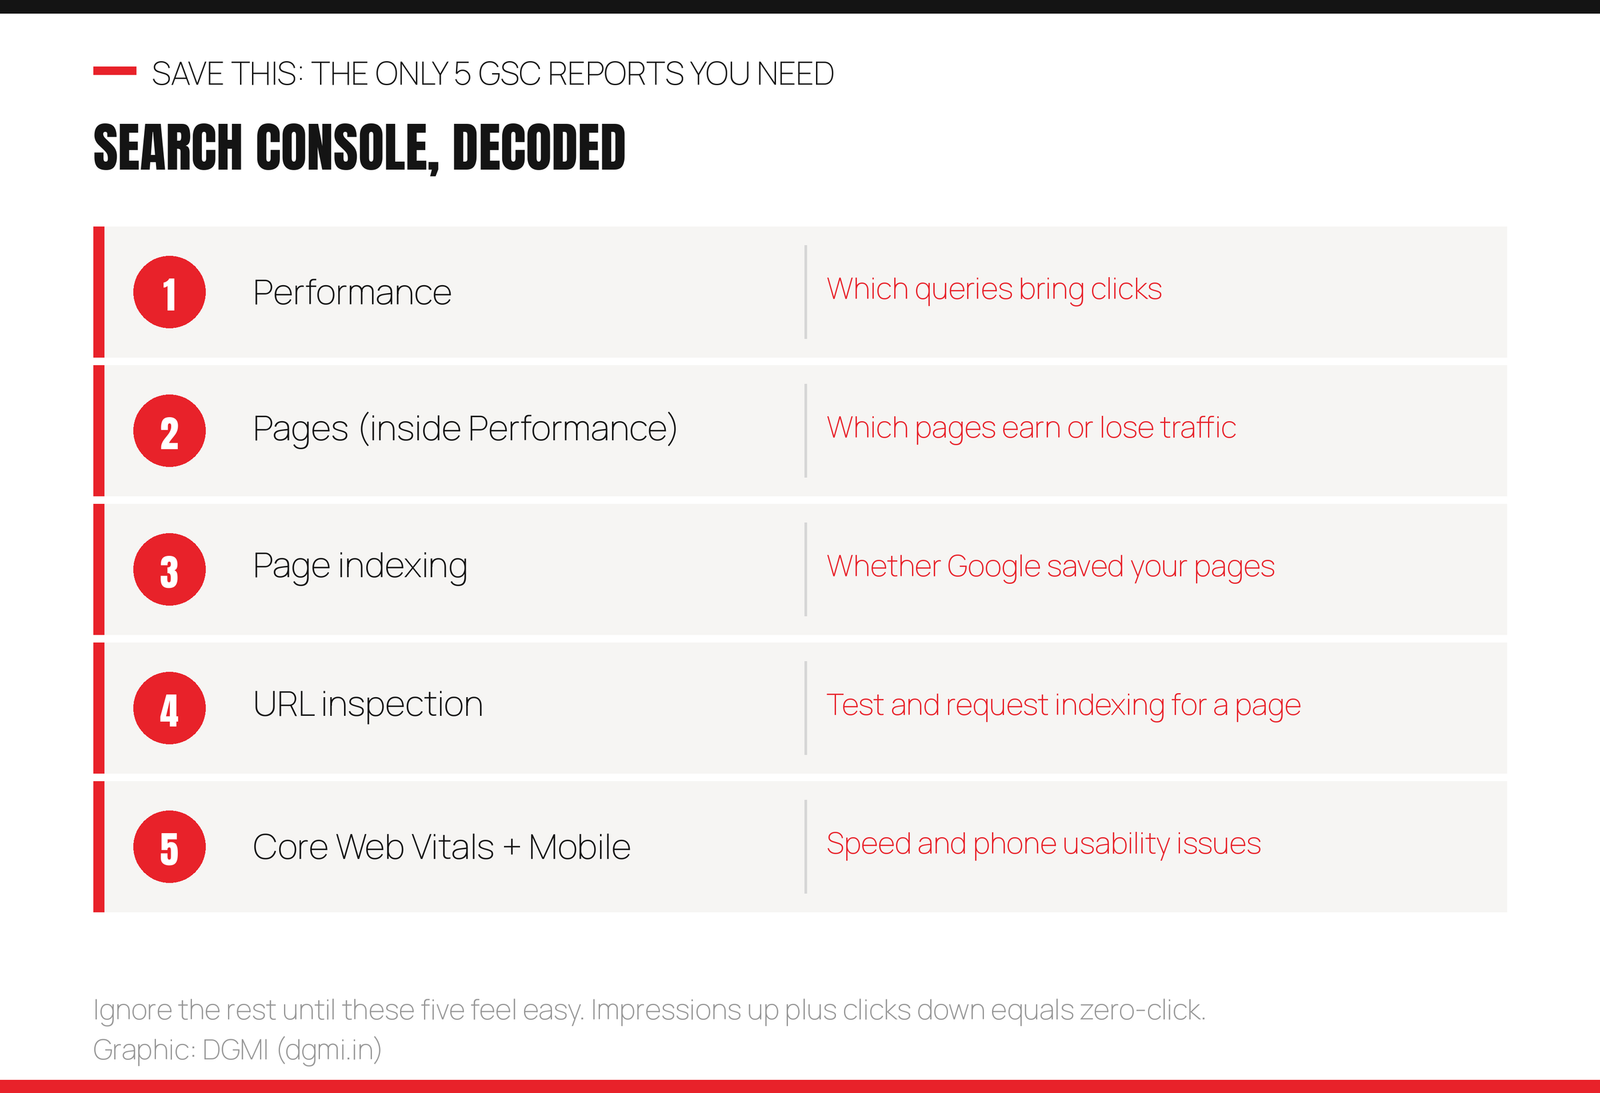
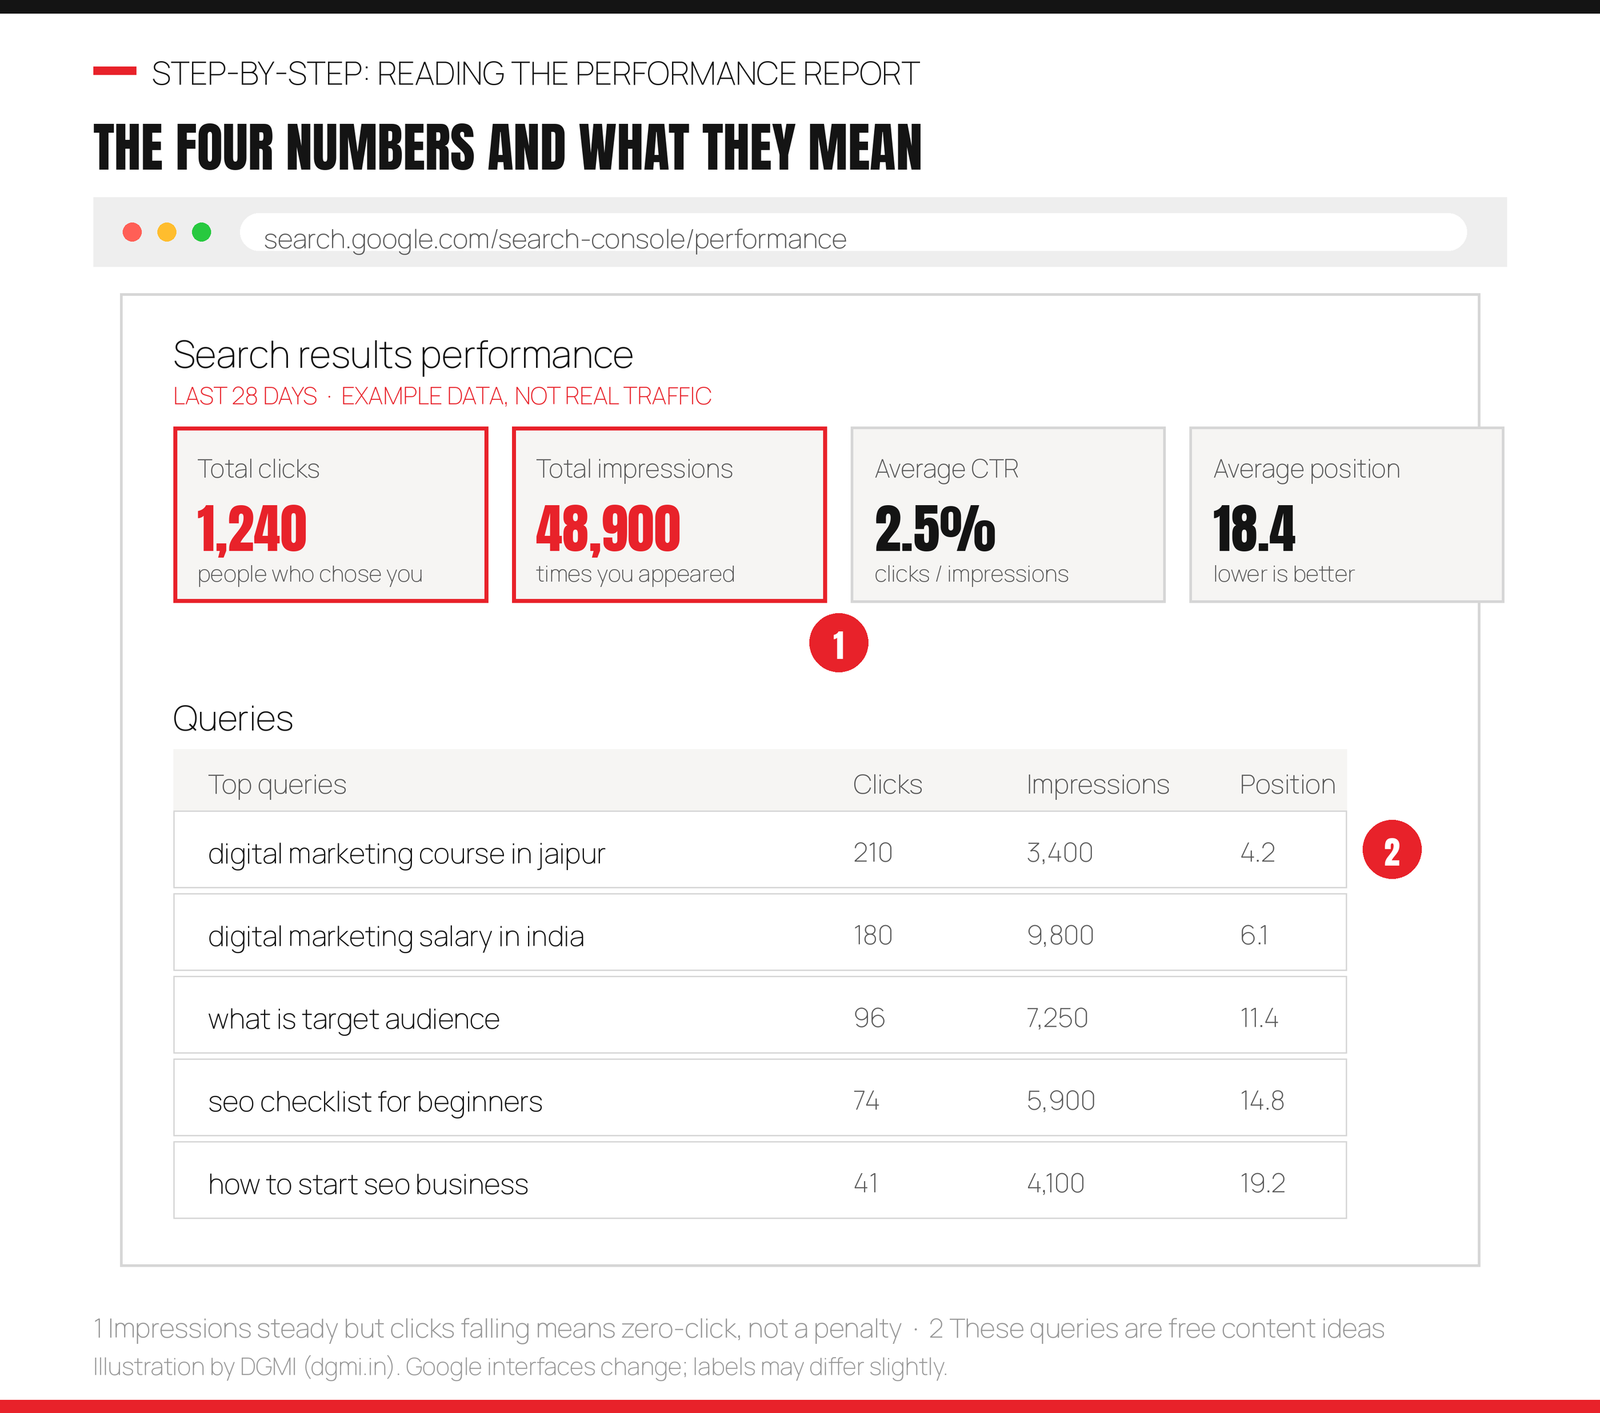
Performance is where you will spend 80% of your time. It shows four numbers: impressions (how often you appeared), clicks (how often someone chose you), CTR (clicks divided by impressions) and average position. Switch to the Queries tab to see the actual words people typed. This is gold for content ideas, because it shows real demand rather than guesses, which is exactly the research method in our audience research guide.
Pages (a tab inside Performance) ranks your pages by clicks. Compare two date ranges to spot which pages are gaining or slipping, and prioritise updates accordingly.
Page indexing answers a question that sounds basic but breaks many small sites: has Google actually saved your pages? If a page is not indexed, it cannot rank, no matter how good it is. Check here first whenever a new page seems invisible.
URL inspection (the search bar at the top) tests any single URL, tells you whether it is indexed, and lets you request indexing after publishing or updating a page. I use this after every meaningful edit on a client site.
Core Web Vitals and Mobile usability flag speed and phone-experience problems. Do not obsess here; fix genuine red errors and move on, since content and relevance matter more.
8. Reading the Data: 4 Real Diagnoses
Setting up tools is the easy half. The skill that gets you paid is looking at a pattern and knowing what it means. Here are four situations I see constantly, with the reasoning spelled out.
Pattern 1: impressions steady or rising, clicks falling. In Search Console this is the signature of the zero-click era: you are still appearing, but Google’s AI answers and rich results are satisfying people before they click. This is not a penalty and there is nothing to “recover”. The response is to make your title and description more compelling for the queries that still deserve a click, and to focus on being the cited source rather than chasing raw traffic. Full explanation in our SEO vs GEO vs AIO guide.
Pattern 2: GA4 shows visitors, key events show zero. Ninety percent of the time this is broken tracking, not a broken website, especially if it started suddenly. Test the form yourself, watch DebugView, and check whether someone republished the site or changed the form plugin. Only after tracking is confirmed working should you conclude the page is failing to convince people.
Pattern 3: lots of traffic, no enquiries, high engagement. If people genuinely stay and read but never contact you, the mismatch is usually intent: you are attracting researchers, not buyers. Check the queries in Search Console. If they are all “what is” and “how to”, you have informational traffic and need commercial pages targeting “cost”, “near me”, “best”, “hire” style searches to convert. This exact diagnosis is why keyword intent matters so much in our keyword research guide.
Pattern 4: one channel collapses overnight. Sudden single-channel drops are almost always technical or account-level, not algorithmic: an expired ad card, a paused campaign, a site update that removed the tag, or a page that stopped being indexed. Check the boring explanations before the dramatic ones. In twelve years, “Google penalised us” has been the correct answer far less often than “somebody changed something and forgot to mention it.”
9. The 15-Minute Weekly Routine
Dashboards are useless without a habit. This is the rhythm I use, and it genuinely fits in fifteen minutes once set up.
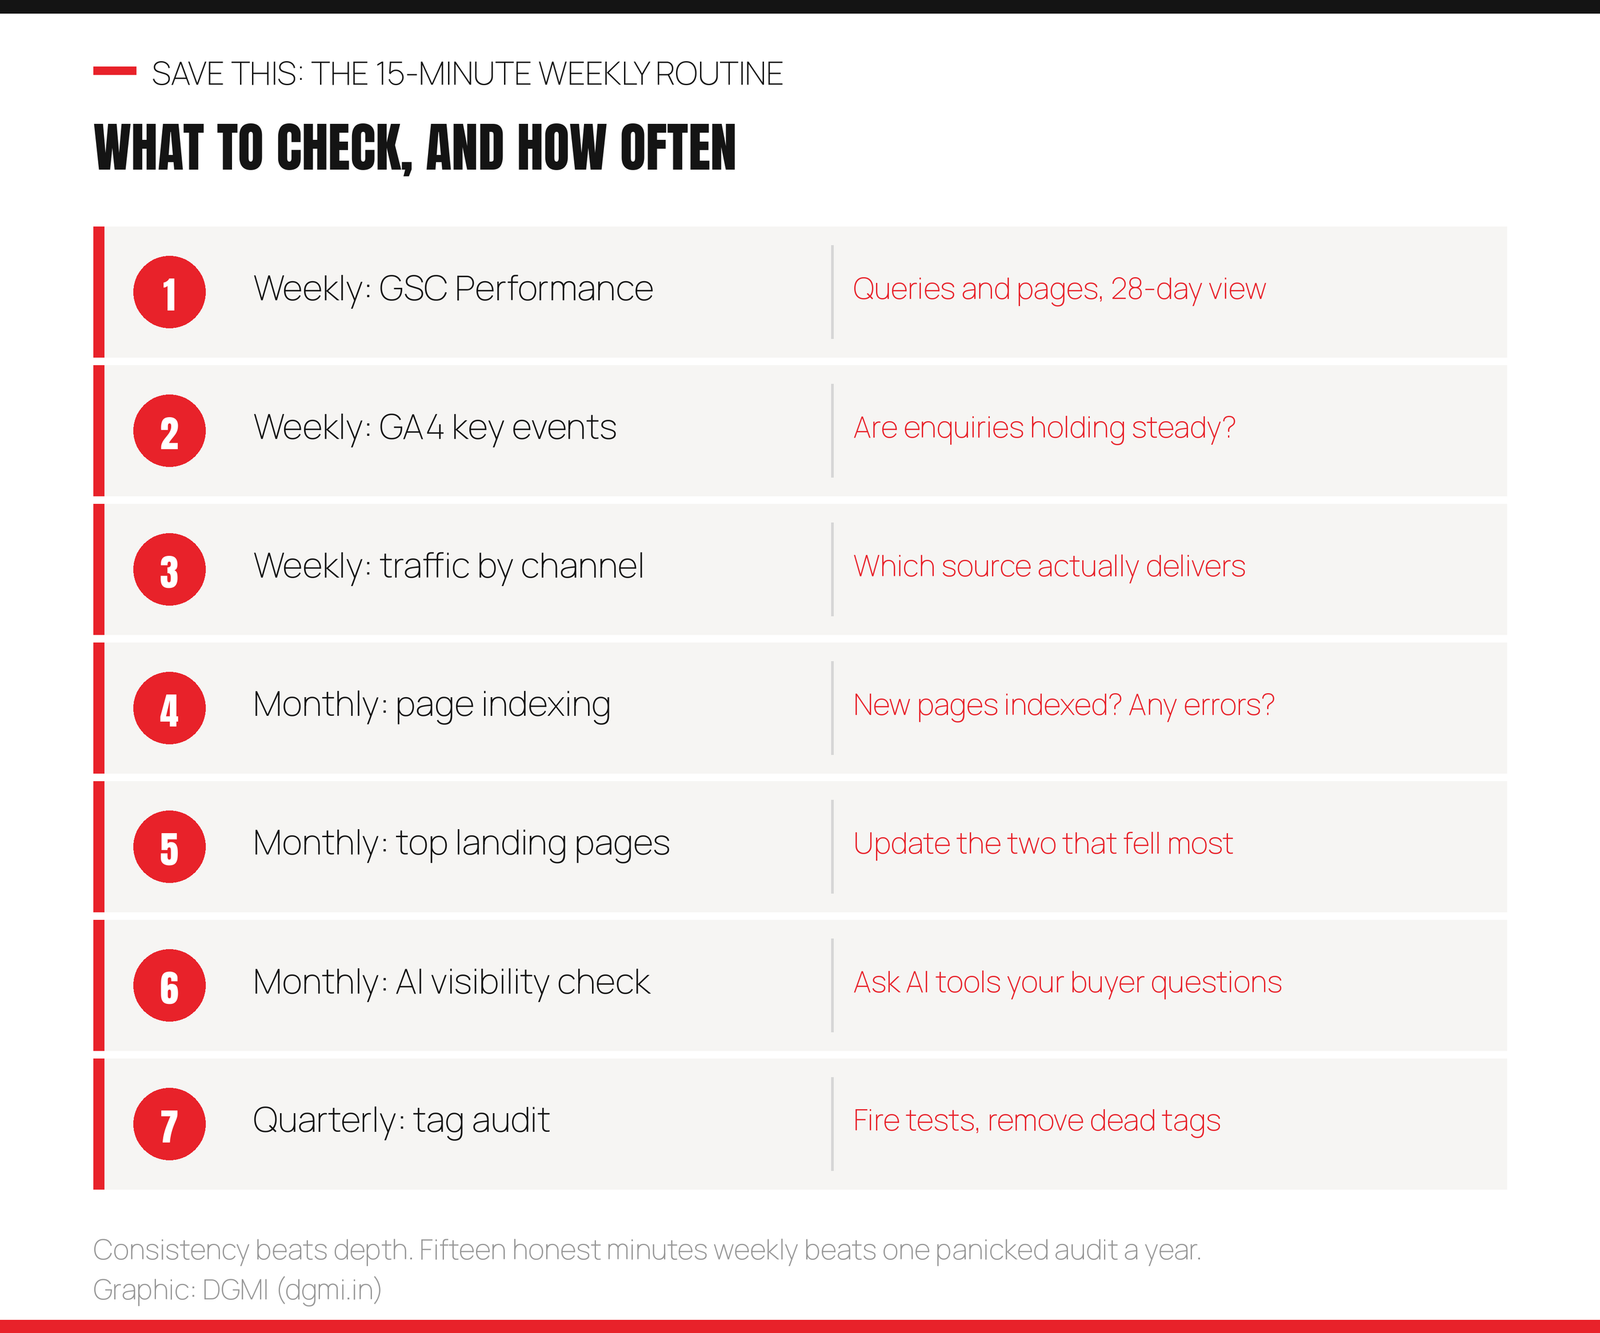
Weekly, open Search Console Performance on a 28-day view and note whether clicks and impressions are trending up or down, then glance at your GA4 key events to confirm enquiries are still being recorded, then check traffic by channel to see which source is carrying you. That is ten minutes. Write two lines in a simple sheet: what changed, and what you will do about it. The writing matters more than the looking, because it forces a decision.
Monthly, verify new pages are indexed, pick the two landing pages that fell most and update them, and spend five minutes asking AI tools the questions your customers ask to see whether you are mentioned. Quarterly, test your tags again, because sites get rebuilt and tracking quietly dies.
10. Nine Mistakes Beginners Make
- ✗ 1. Not filtering internal traffic. Your own visits inflate everything and hide the truth.
- ✗ 2. Building tags in GTM and forgetting to publish. Nothing is live until you Submit.
- ✗ 3. Never verifying with DebugView. Assumed tracking is the most expensive kind.
- ✗ 4. Leaving data retention at the default. Ten seconds now, or lost history forever.
- ✗ 5. Double-counting conversions by importing GA4 key events into Ads while a native Ads tag also fires. Pick one source.
- ✗ 6. Panicking at GA4 and Ads showing different numbers. They measure differently by design, with different attribution and windows. Compare each to its own history, not to each other.
- ✗ 7. Tracking everything. Ten “key” events means nothing is key. Track the three actions that make money.
- ✗ 8. Reporting sessions to clients or bosses. Report enquiries, calls and revenue signals; nobody pays for traffic.
- ✗ 9. Setting up accounts on a personal Gmail that leaves with the intern. Own your data properly from day one.

11. FAQ
Are GA4, Search Console and Tag Manager free?
Yes, all three are completely free for the vast majority of websites. GA4 has a paid enterprise tier (Analytics 360) for very large organisations with high data volumes, but a normal business site will never approach those limits. Search Console and Tag Manager are free without qualification. There is no upsell you need to worry about as a beginner.
Do I really need Tag Manager, or can I just install GA4 directly?
You can install GA4 directly, and for a simple site with no ads it will work fine. But the moment you add a second tracking code, a Google Ads conversion, a Meta pixel, or want to track button clicks, you will wish everything lived in one place. GTM takes fifteen extra minutes to set up once and saves hours repeatedly afterwards. My recommendation: use it from day one, especially if you plan to do this professionally, because every agency and client setup you meet will use it.
What is the difference between key events and conversions?
They are the same idea with different names in different tools. Since March 2024, GA4 calls important actions key events, while Google Ads uses conversions for actions it counts for bidding and reporting. The flow is: an event happens, you mark it a key event in GA4, and if you import it into Google Ads it appears there as a conversion. Older tutorials saying “set up conversions in GA4” are describing the same toggle under a retired name.
Why do GA4 and Google Ads show different conversion numbers?
Because they measure different things by design. They use different attribution models, different lookback windows, and count at different moments (Ads often credits the day of the click, GA4 the day of the action). Google Ads also uses conversion modelling for cross-device journeys. Small differences are normal and not a bug. The practical rule: use Google Ads numbers for optimising Ads campaigns, use GA4 for understanding overall site behaviour, and compare each tool against its own past rather than against the other.
How long does data take to appear?
GA4 shows real-time data within seconds and standard reports usually within 24 to 48 hours. Search Console typically takes two to three days for initial data after verification, and its reports always lag by a couple of days, so today’s numbers appear later this week. Do not judge a new setup on day one; verify it works with DebugView instead of waiting anxiously for reports.
Can I use these tools without a website, for social media only?
Partly. GA4 and Search Console are website tools, so with no site there is little for them to measure, though GA4 can track app traffic. If you sell only through Instagram or WhatsApp, your measurement lives inside those platforms’ own insights. That said, this is a strong argument for having even a simple website: it is the one property you own and can measure properly, while platform reach can change overnight.
Is analytics a good career specialisation in India?
Yes, and it is quietly one of the best. Every other marketing lane depends on measurement, most marketers are weak at it, and the person who owns the numbers tends to own the room in strategy meetings. Senior analytics roles reach roughly ₹14 to 17 lakh a year, and the scarcity is real outside metros. It also pairs beautifully with any other specialisation: an SEO or ads specialist who genuinely understands GA4 and GTM is far more valuable than one who does not. Our specialisation guide compares all the lanes with salary data.
🚀 Stop Guessing. Start Measuring.
DGMI’s 3-month Digital Marketing + AI Course (₹29,999) includes full practical training on GA4, Search Console, Tag Manager and conversion tracking, alongside SEO, GEO, ads, content and AI workflows, all live and 1:1 on real projects with worldwide-recognized certification. Start with a free practical crash course class.
Questions? Contact us · hello@dgmi.in · +91 96940 03464

Official documentation and sources: Google: set up Analytics for a website · Google: key events in GA4 · Google Tag Manager setup guide · Google Search Console help · Google: DebugView and troubleshooting
Use the data next: the SEO checklist · the keyword research guide · the audience research guide · the SEO vs GEO vs AIO guide · the 100 AI prompts library (analytics section) · the specialisation guide · the start an SEO business checklist · discuss in the DGMI Community.
[…] Treat views as reach, not success. A view means your post appeared in front of someone, nothing more. The success metrics remain the actions underneath: calls, direction requests, website clicks, bookings, WhatsApp messages. Views tell you which posts earn attention; actions tell you which posts earn customers. You need both halves, and the actions side lives in your Performance tab and your own enquiry records, which is exactly the outcome-first reporting habit we teach in our analytics guide. […]
[…] property, writing ad copy, and building pages within the first month. Our free SEO checklist and analytics guide show the kind of hands-on depth a real syllabus should […]
[…] page by page. Add six essential plugins (SEO, caching, forms, security, backups, WhatsApp), connect GA4 and Search Console, check every page on your phone, and launch. Total cost of the theme: ₹0. Total time for a […]
[…] · WordPress website cost in India · Astra theme tutorial · SEO checklist for beginners · GA4, Search Console and Tag Manager guide · 100 AI prompts for marketers · Freelance clients guide · DGMI CommunityEvery ‘best free […]